
Read the market. See the opportunity.
Regional market comparisons · Sources and dates with every figure.
About this research
Go beyond the listing. Explore rents, pricing, supply and financing conditions to understand what’s moving a market—and what it means for your next investment.
Built for investors. Grounded in public data.
Explore the dataCompare Sioux Falls, Fargo, Omaha, Des Moines, Lincoln and Rapid City. Figures cover metro areas. Local ZIP and parcel research currently covers Sioux Falls.
ZIP data, parcel research, the 3D map and insured apartment debt currently cover Sioux Falls.
Explore Sioux Falls.
A captured 3D research view, alongside dated housing indicators for the metro and seven ZIP codes.
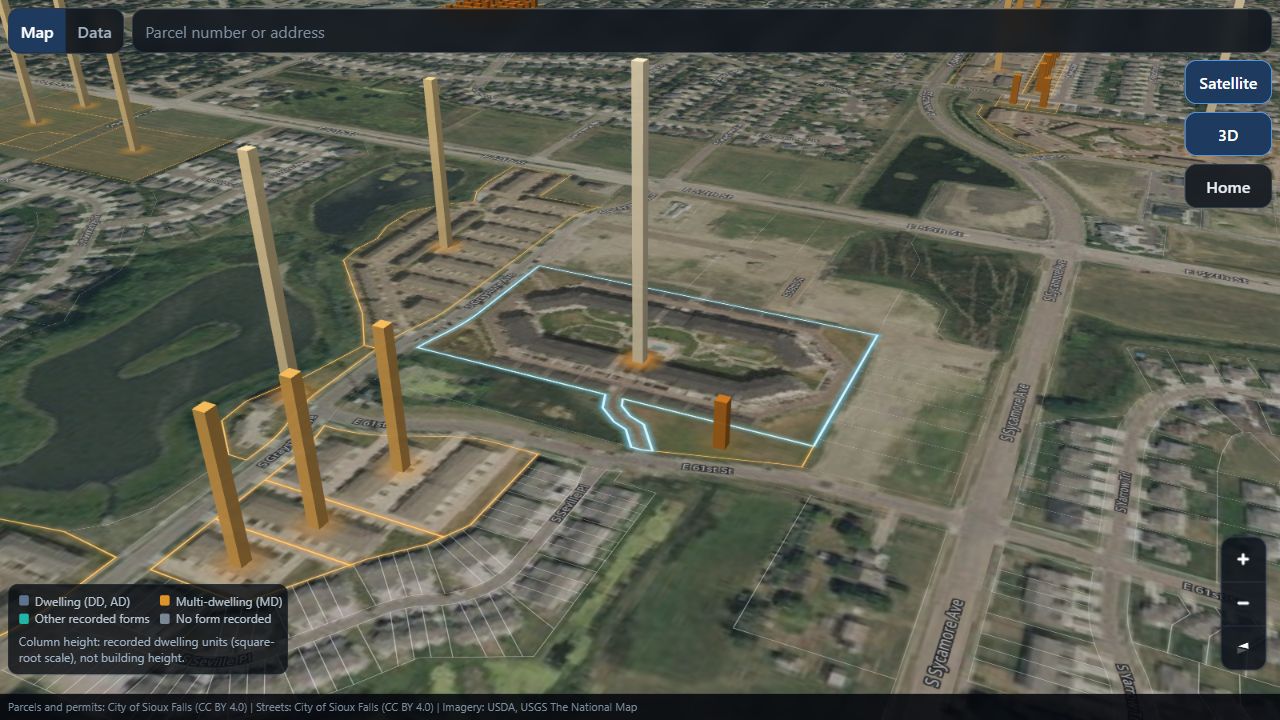 Open 3D map ↗ New tab · Sign-in required
Map sources & methodology
Captured from the actual Market Radar 3D map on October 19, 2026. Column height represents recorded dwelling units on a square-root scale, not building height.
Parcels, permits & streets: City of Sioux Falls, CC BY 4.0. Imagery: USDA / USGS The National Map.
Compare the metro & ZIP codes
Key housing indicators for the Sioux Falls metro area,
from Realtor.com Economic Research.
Loading available reporting periods…
Loading the published research snapshot…
Source: Realtor.com Economic Research · Reporting period: September 2026
More housing indicators
Read the market brief & research notes
How to read these figures
Select a geography to see the published indicators.
Source: Realtor.com Economic Research, presented in Metastone Markets. Monthly history coverage varies by geography and indicator. The publisher may revise past observations. Missing observations are shown as unavailable. Year-over-year changes compare the same source, geography, and month.
A clearer view.
Right in your inbox.
Free Sioux Falls market updates.
Local housing signals, source-backed context, and the details worth watching in Sioux Falls.